
Introduction
Website errors can disrupt user experience and prevent key features from working correctly. If you want to debug website errors using Chrome DevTools, you can use built-in browser tools to identify error messages, inspect requests, and pinpoint the source of problems. A systematic debugging approach saves time and leads to more reliable fixes.
Understanding the Tool or Feature
Key DevTools panels for debugging
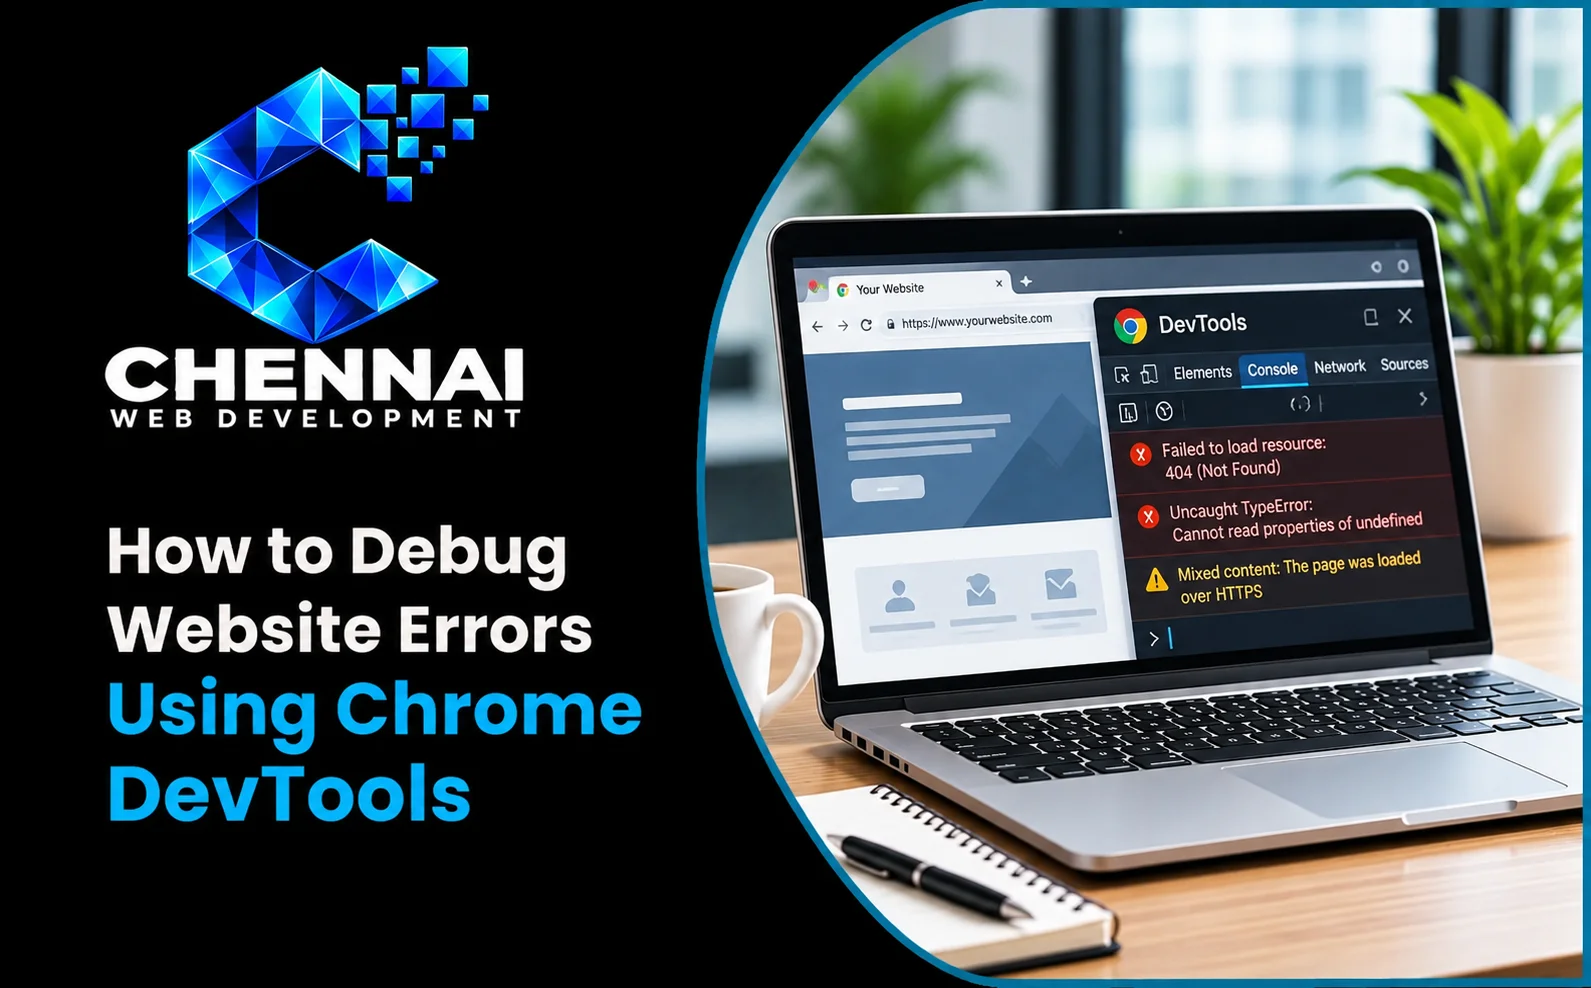
Chrome DevTools includes panels such as Console (error logs and messages), Network (requests, responses, status codes), Elements (DOM/CSS inspection), and Sources (script debugging and breakpoints). Together, these tools help diagnose frontend issues in websites and applications built through website development company in Chennai.
Requirements Before Starting
Before debugging
Use Google Chrome (or a Chromium-based browser), open the affected page, and be able to reproduce the issue consistently. Access to the website’s source code is needed for permanent fixes. If the issue involves APIs or backend responses, coordination with developers and tools used for API integration services may be helpful.
Step-by-Step Tutorial
Debugging errors with Chrome DevTools
- Open DevTools: Right-click and select Inspect, or open DevTools from the browser menu.
- Check the Console: Review error and warning messages, stack traces, and file/line references.
- Inspect the Network panel: Reload the page and examine failed requests, status codes, headers, and response payloads.
- Examine Elements and styles: Inspect DOM structure and CSS if the issue is visual or layout-related.
- Use Sources for scripts: Set breakpoints, step through code, and inspect variables for JavaScript issues.
- Reproduce and isolate: Disable extensions, clear cache, or test different conditions to narrow the cause.
- Apply and verify fixes: Update source code, then retest to confirm the issue is resolved.
When debugging user-facing issues, consider broader experience and usability factors discussed in how website layout and navigation affect user experience and quality checks from cross-browser and device website testing checklist.
Practical Examples
Common debugging scenarios
If a form submission fails, the Network panel may show a 400/500 response with details in the payload, while the Console may log script errors. If a layout breaks after a script runs, the Elements and Console panels can help trace the cause. Resolving these issues improves reliability for sites supported by ongoing website maintenance and support services and development services.
Understanding the Results
Interpreting DevTools findings
Error messages and failed requests point to symptoms; root causes may be in frontend code, third-party scripts, or backend services. Validate fixes across browsers/devices when relevant and monitor for regressions after deployment.
Common Mistakes
What to avoid
- Ignoring warnings and focusing only on the first visible error.
- Making random changes without reproducing the issue consistently.
- Overlooking failed network requests related to APIs or assets.
- Not clearing cache or considering extension interference during testing.
- Applying fixes without retesting the full user flow.
Best Practices
Recommendations
Reproduce issues reliably, use Console/Network/Sources together, and document findings for your team. Test fixes in staging when possible and maintain code quality with consistent version control practices. For detailed tool usage, consult Chrome DevTools documentation.
For complex issues, compare behavior across different browsers or devices to determine whether the problem is browser-specific or systemic. You can also use the Performance and Application panels when relevant to investigate slow interactions, storage issues, or caching behavior that may contribute to errors. A broader diagnostic view often reveals root causes more quickly.
After resolving an issue, consider adding notes or checks to prevent similar problems in future updates. Consistent debugging practices, combined with testing and version control, help maintain a stable website experience and reduce the time needed to address new errors.
By applying these steps consistently and reviewing results over time, you can make informed improvements that support better performance, usability, and long-term digital growth for your website.
Taking a consistent, methodical approach to this process will help you identify opportunities, resolve issues more effectively, and make decisions based on clear evidence. Over time, regular reviews and thoughtful improvements can strengthen your website’s performance, usability, and overall results.
Consistently applying these best practices, validating changes, and learning from performance data will help you achieve more reliable outcomes. A proactive and detail-oriented approach ensures your website remains effective, user-friendly, and aligned with your long-term goals.
Conclusion
When you debug website errors using Chrome DevTools, you gain the visibility needed to diagnose and resolve issues efficiently. By combining console insights, network analysis, and targeted code inspection, you can improve site stability, user experience, and overall quality.